Management strategies: 3 ways to make profit with CSRD
1, Quick wins from sustainable sourcing
(Scope 3 and Scope 2)
The main emissions of manufacturing and trading companies are resulting from purchased materials (Scope 3), plus purchased electricity (Scope 2). Quick reductions can therefore be realised by “sustainable sourcing”.
The best way to monitor the results in dashboards, is to show the carbon footprint and total eco-costs, per kg (or any other relevant unit), per type of product (not per supplier, since you may switch to a new supplier). See Fig. 8.5a. An issue here is how to select a new supplier: this might be done on the basis of the current carbon content of the material of the new supplier, but an estimation on the future improvements may play an important role as well (e.g. based on the SDG performance, see example Kappa Packaging/ Ecolibri).
Note 1. Only a few suppliers know their carbon content, but a Fast Track LCA (use the LCA tool of this website) may help, based on the carbon content of electricity in the region of production and the transport distance (example for packaging: Pickler.io )
Note 2. Don’t fool yourself with an “unbundled” Guarantees of Origin (GO) or REC (in the GHG Protocol Reporting Standard recommended in the Alcoa example, Chapter 8, page 61), since this kind of misleading information will not last long, see webpage on GOs and RECs. Accept only “bundled” certificates. Switch to real sustainable energy suppliers by PPAs (power purchase agreements) or own renewable energy sources like PV cells.
2. The wins from energy savings (Scope 1)
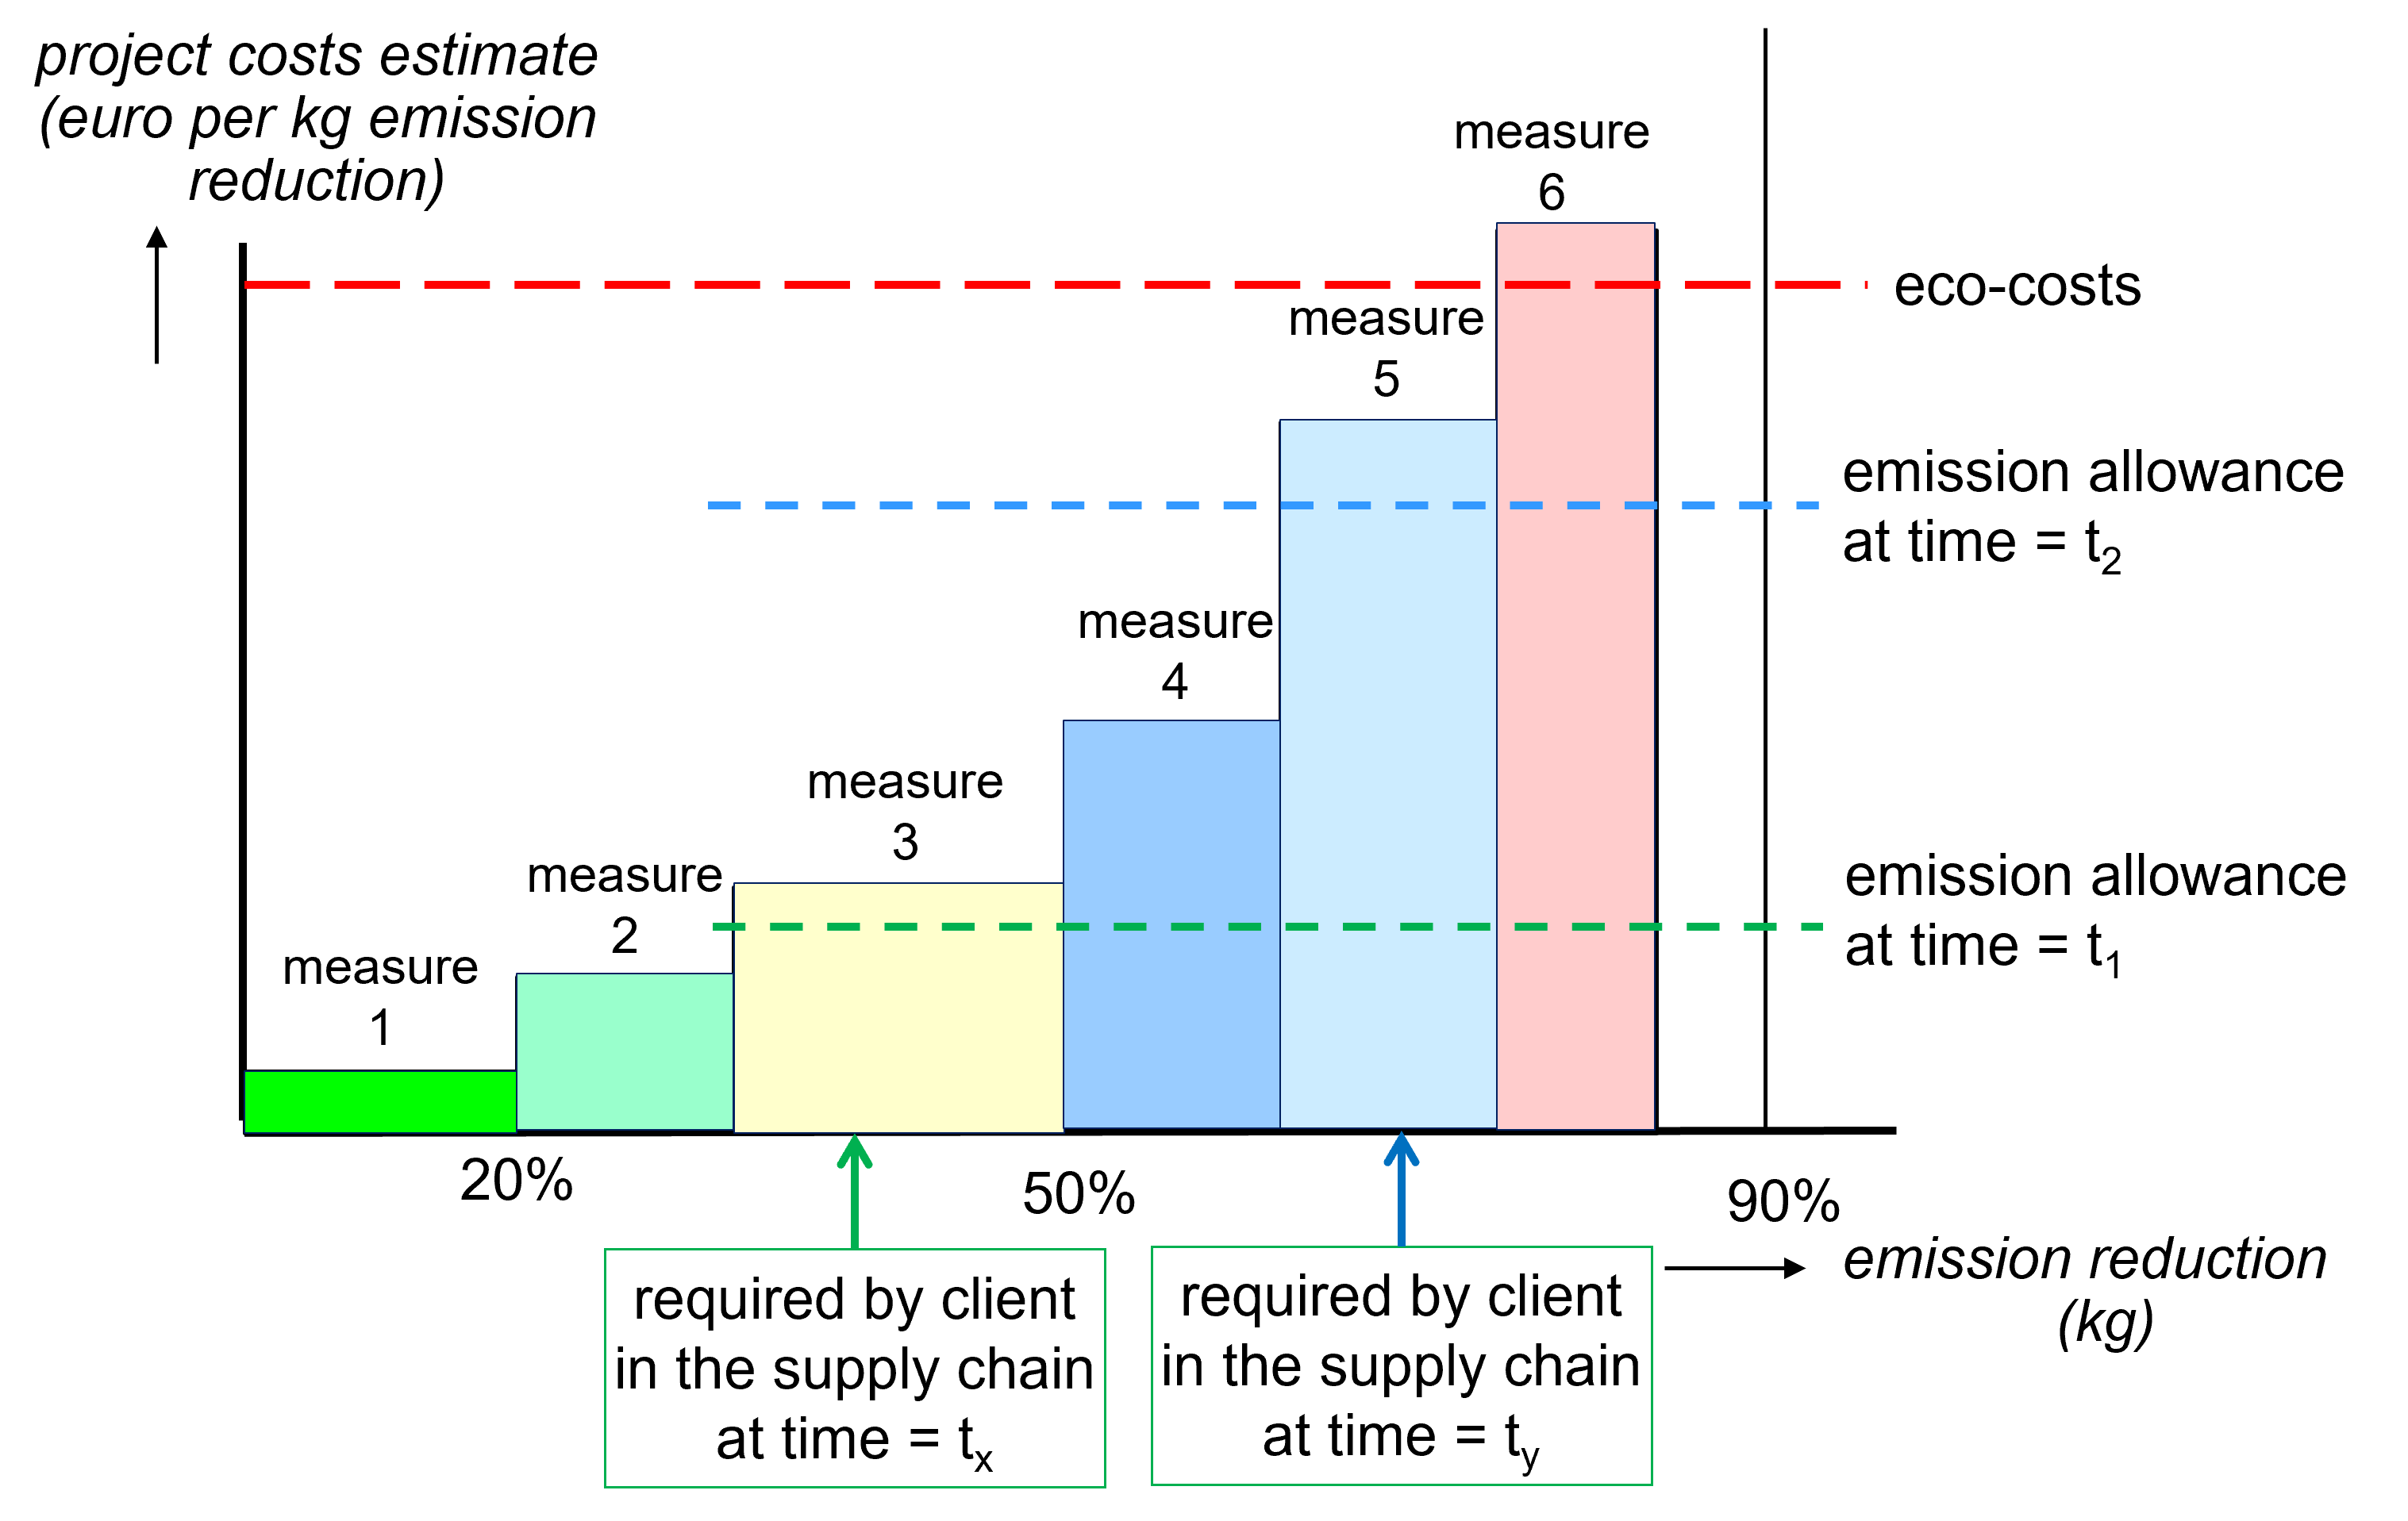
An obvious way to reduce the Scope 1 carbon footprint is energy savings, either by savings of heat or travel (and transport). Since these kind of savings are also related to costs savings, most companies already did a lot in this field. Only in chemical factories and food processing plants, there are still considerable opportunities of heat recovery as the costs of energy as well as the costs of Carbon allowances are still rising. See Fig. 8.5b. and Eco-Efficient Value Creation (book), Section 9.3 “Timing of improvement projects”.
Content
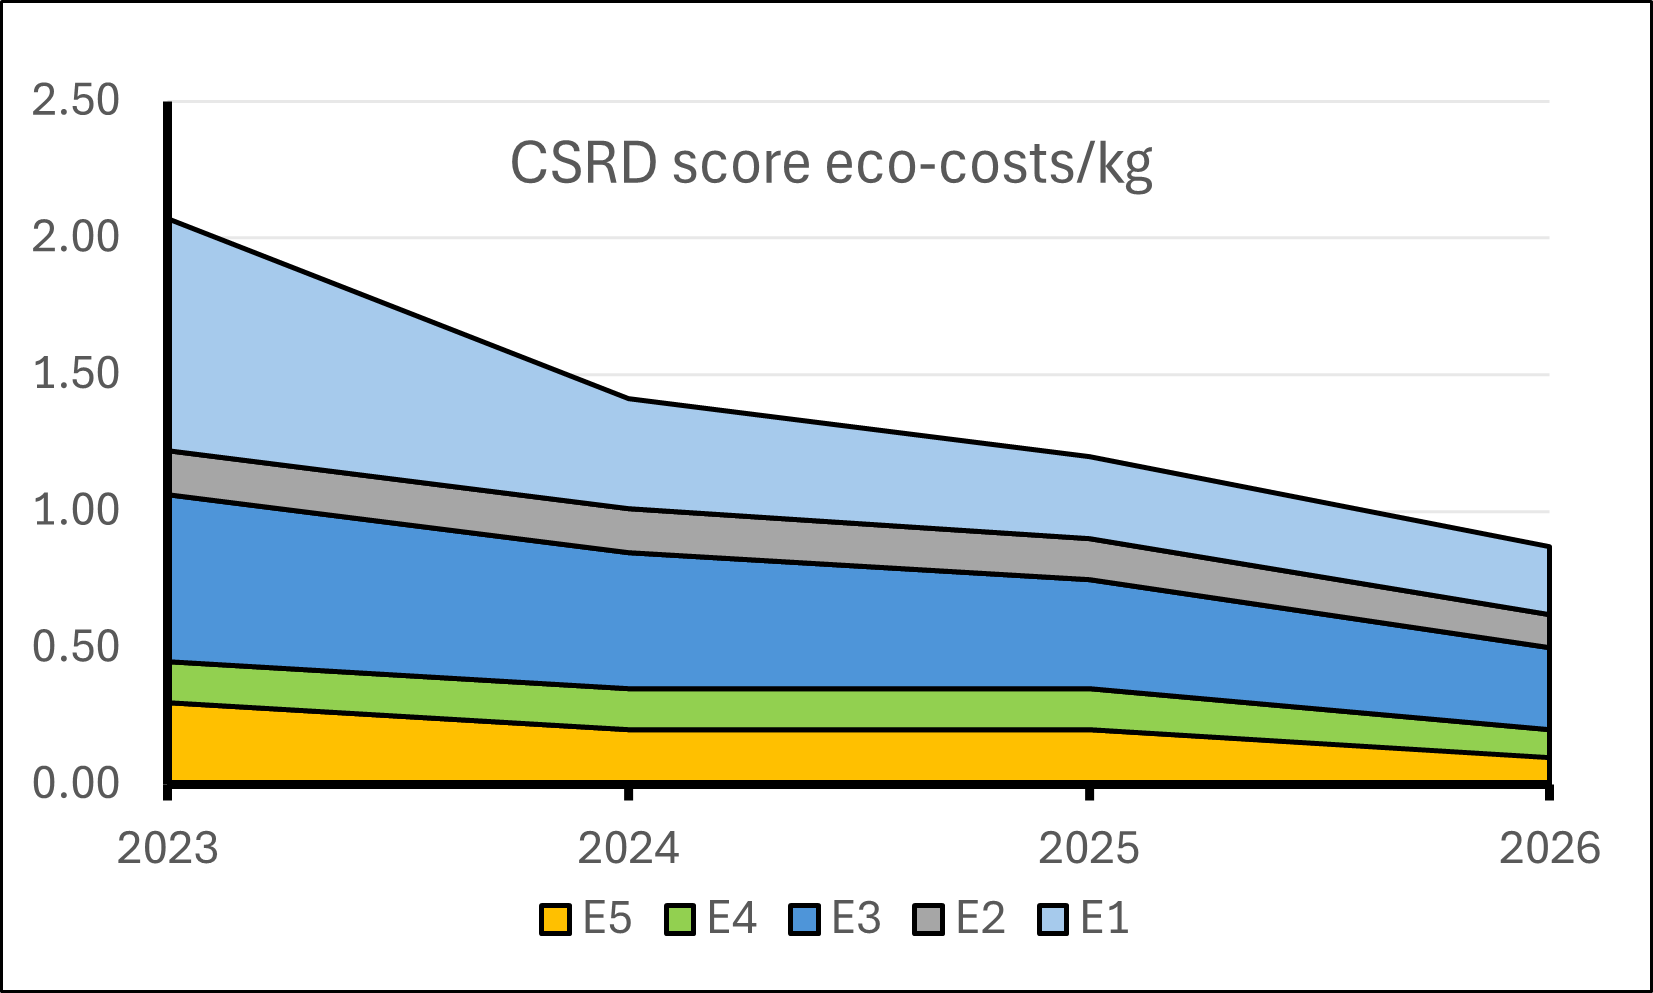 Figure 8.5a. An example of a CSRD dashboard of a company: the eco-costs per kg. Note that it shows the eco-costs scores for each category: E1 (Climate Change); E2 (Pollutants); E3 (Water and marine resources); E4 (Biodiversity); E5 (resource use)